The Solar-Wind-Battery Superpower Revolution by 2050: Four Scenarios for the Netherlands and Europe
The world is on the cusp of a Solar-Wind-Battery (SWB) superpower revolution. Visionary technologists like Tony Seba argue that plunging costs and S-curve adoption dynamics of solar, wind, and battery technologies will disrupt energy as profoundly as the automobile disrupted horse-drawn transport over a century ago. In fact, solar power costs have plummeted over 80% since 2010 and are now cheaper than coal or nuclear (IRENA), and lithium battery prices have fallen nearly 90% in the last decade (BloombergNEF) – an exponential decline that is driving rapid uptake.
This means that building excess SWB capacity (even beyond today’s demand) is becoming the cheapest way to power and future-proof our economies (ReThinkX, IEA WEO 2023). SWB systems naturally produce superabundant clean energy at near-zero marginal cost, especially when sized to meet needs on the least sunny or windy days (Nature Energy, Joule). The result is surplus power (“SWB superpower”) available most of the time, which can be used for new industries (green hydrogen, clean fuels, desalination, etc.) or simply curtailed with minimal cost penalty (Joule, MDPI Energies).
The Netherlands stands at a crossroads in this revolution. Already, the Dutch have seen renewable electricity soar from single digits to over 56% of supply by 2024 (CBS), with offshore wind alone slated to provide 75% of electricity by 2032 (Rijksoverheid). But what path will the Netherlands – and Europe – take toward 2050? Here we explore four vivid future scenarios:
- Scenario 1 – The Netherlands Leads Early: Starting 2025, the Netherlands “gets” the SWB disruption ahead of others and pivots sharply to solar, wind and batteries – abandoning new fossil fuel and nuclear plans. The Dutch go all-in on SWB deployment and innovation, while much of Europe lags behind (some clinging to nuclear or mixed strategies).
- Scenario 2 – Europe Unites on SWB: The entire EU recognizes the SWB Superpower opportunity early and coordinates infrastructure and policy. Europe as a whole goes big on solar, wind and storage, with high-voltage grids and unified investments creating an integrated clean energy system continent-wide.
- Scenario 3 – Messy Transition (Most Likely): The EU muddles through with a patchwork of slow, diverse strategies. There’s progress on renewables, but it’s uneven and delayed by political compromises – some countries push nuclear or gas longer, others push renewables hard. The result is a slower, costlier route with suboptimal integration (but SWB still grows because economics ultimately win out).
- Scenario 4 – The Contrarian Retreat: In a contrarian twist, Europe – and the Netherlands – actively resist the SWB transition, influenced by misinformation or incumbent lobbies. Renewables and batteries are neglected in favor of legacy energy (fossil fuels, perhaps a few new nuclear plants, and even prolonged use of coal/gas infrastructure). This scenario is a cautionary tale: clinging to the past in the face of an inevitable technology disruption.
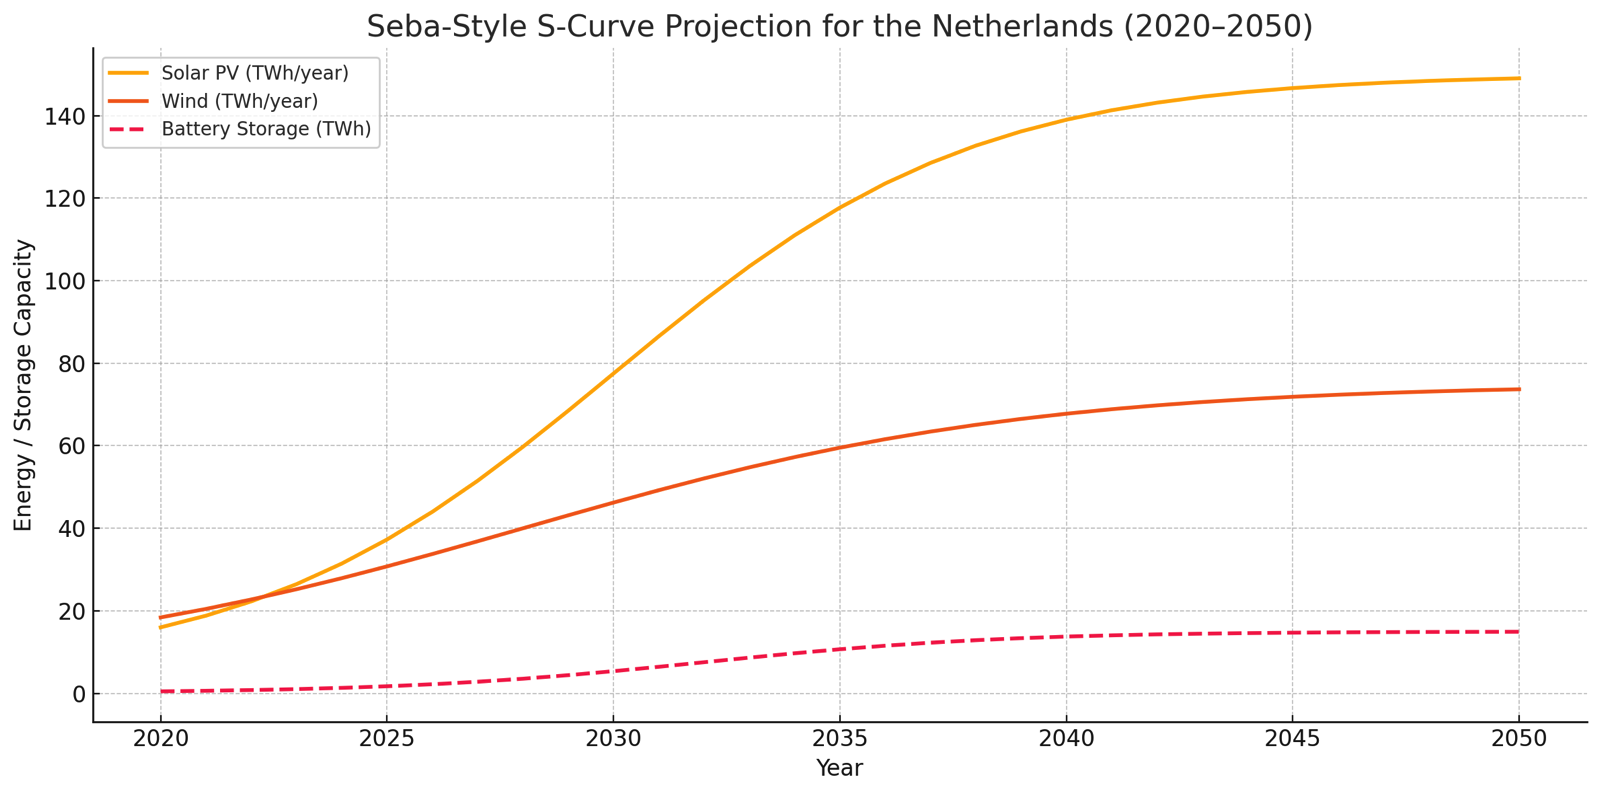
Figure: Seba-style S-curve projection for the Netherlands (2020–2050). Solar, wind, and battery adoption accelerate exponentially toward a superabundant energy future.
Below, we delve into each scenario, modeling the required solar/wind capacity for the Netherlands by 2050, how much battery storage might be needed, the land/space implications (“how many km² of panels?”), the investment costs and infrastructure needs, and the expected curtailment (surplus power) and overcapacity in each case. We’ll also compare to real-world EU policy data – from nuclear build-outs to renewable targets – to ground these scenarios in current plans. Finally, we conclude why, even if Europe stumbles (Scenario 3), the sheer economic logic of SWB Superpower is poised to prevail by 2050.
The SWB Adoption S-Curve: Why Change Could Happen Fast
Before jumping into the scenarios, it’s important to understand why the SWB revolution could unfold quickly, following an S-curve adoption pattern. Tony Seba’s disruption model emphasizes that once a new technology undercuts the old on cost and performance, adoption can go from nearly zero to dominant in just a couple of decades. We’ve seen this before – think of how horses disappeared from city streets in the early 1900s once affordable cars arrived. (In New York City, there was only one car amid horse carriages in 1900, but by 1913 the roles flipped – cars everywhere and hardly a horse in sight – a dramatic 13-year transition often cited by Seba.) This happens because multiple feedback loops kick in: cheaper energy drives more adoption, which scales manufacturing and drives prices down further, which spurs even more adoption, and so on.
We are already seeing early signs of this in energy. Renewable costs have collapsed – for example, the global average cost of solar electricity fell from $378 per MWh in 2010 to just $68 by 2019, an 82% drop. Onshore wind costs fell ~70% in a decade, and battery packs for energy storage dropped about 87% in price from 2010 to 2019 (from ~$1100 per kWh to ~$156). These declines are projected to continue as production scales. By the late 2020s, new solar and wind will likely be the cheapest energy in history, far cheaper than running existing coal or gas plants. This cost dynamic means it can be cheaper to overbuild renewables and simply curtail excess power than to keep fuel-burning plants as backup.
Indeed, researchers found the least-cost 100% SWB system involves building roughly 3.8× the generation capacity needed for peak demand, and around 1–1.2 TWh of battery storage per 10 million people (for ~1–2 days of average demand) – resulting in ample “superpower” surplus most of the year. Oversizing capacity to handle worst-case winter weeks leads to summer surpluses, but those extra gigawatts come at near-zero marginal cost and can generate twice today’s demand in cheap surplus energy for new uses. In short, 100% SWB isn’t just feasible – it’s economically optimalon a 2030 timeline for new power, thanks to the clean energy U-curve where a bit more capex on capacity drastically reduces storage needs and costs. This is the key insight underpinning the “SWB Superpower” concept.
With that context, let’s explore how these dynamics play out in our four scenarios:
Scenario 1: Dutch Dominance in SWB – Netherlands Leads, Rest of Europe Lags
In this optimistic scenario, the Netherlands in 2025 boldly redirects its energy strategy to pursue a 100% solar/wind/battery system well before 2050, ahead of its neighbors. The Dutch government cancels plans for new nuclear reactors and fossil gas expansion, focusing all efforts on scaling up renewables and storage. Meanwhile, other European countries remain cautious or sluggish – many stick with “legacy” paths (e.g. France doubling down on nuclear, Eastern Europe on coal/gas with carbon capture, etc.). By 2050, the Netherlands becomes an SWB superpower island of sorts, surrounded by a more slowly evolving Europe.
Solar and Wind Capacity
To achieve this, the Netherlands would need to install on the order of 150+ GW of solar PV and ~75–80 GW of wind capacity by 2050 (roughly a tenfold increase from today’s capacity). For perspective, Dutch researchers at TNO already explored scenarios approaching these magnitudes: in a high-renewables outlook, they projected ~132 GW of solar and 82 GW of wind by 2050. This scenario goes even further, given no nuclear or fossil backup – likely 150 GW or more of solar (utilizing every viable rooftop, sound barrier, and a good amount of countryside for solar farms) and around 70–80 GW of wind (maximizing offshore wind in the North Sea, plus modest onshore turbines). The official Dutch offshore wind roadmap actually targets 72 GW at sea by 2050, explicitly to not only power electricity but also produce green hydrogen for industry. So 75 GW of wind is within planned possibilities, and solar would fill the rest.
Such capacity means the Dutch electricity system in 2050 can supply far more than the country’s annual consumption– by design. In fact, this all-renewable system would likely produce about 2× the total demand as “excess” over a year. During sunny, windy hours, output would vastly exceed real-time needs, while during still winter nights the ample storage (see below) would kick in.
Overcapacity & Curtailment
The Netherlands might deliberately build roughly 2–3× the needed peak generation. Perhaps 30% of yearly potential output might be curtailed as true surplus in this scenario – and that’s fine. That curtailed power is essentially the cost of ensuring reliability on the worst days. (And rather than waste it, Dutch industry could channel a lot of it into making hydrogen, synthetic fuels, or powering flexible processes whenever cheap surplus appears.)
Battery Storage Needs
Even with huge overcapacity, you need storage to cover nights and lulls. By 2050, the Netherlands might deploy on the order of 1.5 TWh of battery storage (terawatt-hours) in this scenario to stabilize supply – a massive amount, yet feasible when spread across grid storage, home batteries, and millions of EVs used as backup on wheels. 1.5 TWh is roughly 50 hours of average Dutch demand. This aligns with models that a few days of storage, combined with ~4× overbuilt generation, enables a 100% renewable supply even in tough periods. The storage would likely be a mix: large-scale lithium batteries for daily cycling, some longer-duration solutions (flow batteries or new chemistries), and possibly seasonal storage via green hydrogen in underground salt caverns or converted gas fields. (The Netherlands has geology suitable for storing hydrogen – an advantage for seasonal buffering.) With ~1.5 TWh, the country could handle multi-day winter wind droughts, especially if paired with demand response. And if EU neighbors are lagging, the Netherlands would rely less on imports for backup, instead investing in domestic storage and flexibility.
Spatial Requirements
Would this blanket the country in solar panels and wind farms? Not quite – though it’s a significant build-out. 150 GW of solar PV might require on the order of 750–1,000 km² of panels (assuming a mix of rooftop, offshore, and ground-mounted panels, with efficient use of space). 1,000 km² is about 2.5% of the Netherlands’ land area, or roughly the area of all rooftops and small towns combined. In fact, a Dutch grid study found that in a maximal “regional” scenario, up to 180 GW of solar (much on rooftops) was imaginable – which would use every feasible roof plus some land. For wind, 75 GW offshore might use on the order of 15,000 km² of North Sea space, but offshore wind farms coexist with some fishing/shipping and are out of sight. Onshore wind in this scenario would be relatively limited (perhaps <10 GW) to minimize land use conflicts – offshore carries the bulk. The solar land footprint, while large in absolute terms, is manageable via creative solutions: solar panels atop warehouses, canals (floating solar), farmland (agrivoltaics), and even integrated into infrastructure. For comparison, 0.5 million km² of solar panels could power the entire world – so the area needed for one small, efficient country is a tiny fraction of that (on the order of 0.001 of global needs!). The Netherlands might cover a few hundred square kilometers of fields with solar – about the size of a medium province or half the area of Luxembourg, scattered around. This is a big change, but not physically implausible.
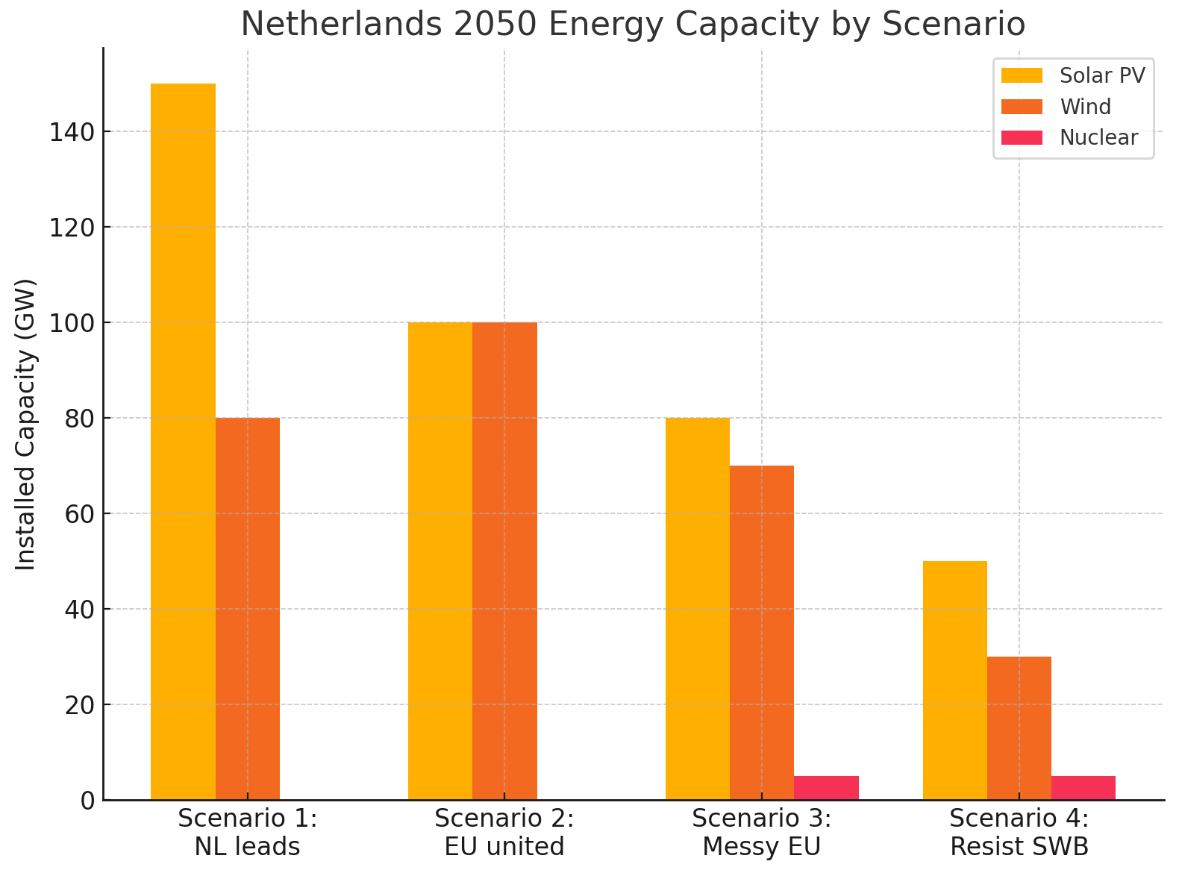
Figure: Netherlands 2050 installed capacity in Scenario 1 vs other scenarios. In the “NL leads” scenario, the country builds on the order of 150 GW of solar and 75–80 GW of wind – far above today’s levels – while avoiding nuclear or new fossil plants. This massive capacity (over 4 times the peak demand) provides cheap surplus energy (curtailment ~30%) but guarantees reliability when sun or wind are low.
System Costs & Investments
The price tag for this all-in approach is significant but surprisingly affordable relative to business-as-usual. Rough estimates suggest on the order of €200 billion spread over 25 years could fund the build-out (e.g. 150 GW solar at ultra-low future costs ~$0.3/W = $45 billion; 75 GW offshore wind at ~$1.5/W = $112 billion; plus $20–30 billion for storage and grid upgrades). That’s roughly €8 billion per year, about 1% of Dutch GDP – not trivial, but in line with current energy spending. Crucially, this investment replaces fuel costs. Instead of paying continually for gas, coal or oil (much of it imported), the money builds infrastructure that then provides virtually free energy for decades.
For comparison, Europe as a whole spent hundreds of billions of euros on fossil fuel imports in 2022 alone during the gas crisis. By 2030, continuing fossil dependence would still cost the EU tens of billions annually. In this scenario, the Netherlands shields itself from such volatility. Moreover, studies indicate a 100% SWB system can be cheaper to run than today’s mix by 2030 – operation of legacy plants becomes more expensive than building new renewables.
Tony Seba’s team found a $115 billion investment could transition California to 100% SWB by 2030 cheaper than staying partly fossil. The Dutch scenario might similarly pay for itself via avoided fuel and carbon costs.
There will be hefty grid infrastructure needs (strengthening transmission, perhaps building a national high-voltage backbone to shuffle all that wind and solar, plus smart grid tech to manage batteries and EV charging). But those costs are manageable with long-term planning – on the order of a few billion a year, which is justified by the €14–55 billion/year benefits a well-integrated EU grid could yield by 2050, as outlined in EU energy integration studies.
Curtailment and Superpower
By 2050, the Netherlands in this scenario experiences frequent periods of “superpower” – surplus clean electricity. On bright summer days or windy nights, generation might be 2–3× domestic demand, forcing prices to zero or negative. Far from being a problem, this is an economic boon and a feature of SWB Superpower systems.
The Dutch could export some of this cheap power to neighbors (if they’ll take it), but with the rest of Europe lagging, let’s assume limited export capacity. Instead, the Netherlands would cultivate new uses for surplus: think electrolyzers cranking out green hydrogenwhenever electricity is dirt-cheap, oxygen and heat for industry, charging of massive battery banks or fleets of electric vehicles at noon, even energy-intensive industries like aluminum smelting or desalinating water running opportunistically.
The scenario unlocks innovation – with essentially free energy many hours of the week, entrepreneurs find ways to productively use it (in line with Seba’s vision of new business models around superabundant energy). Any surplus that still must be curtailed (perhaps ~30% of output annually) is simply not generated – turbines feathered, solar inverters turned down – which is economically fine because the marginal cost of sun and wind is near zero.
Rest of Europe
Meanwhile, other European countries in this scenario are slower on the uptake. France, for instance, pursues a fleet of new nuclear reactors (President Macron’s plan of ~14 new reactors by 2050), aiming to keep nuclear ~25% of its mix. Some Eastern European states and maybe Germany (in this scenario’s departure from reality) stick with some gas or even coal (with carbon capture) for reliability, and only moderate renewable growth.
The EU might still nominally target climate neutrality, but many members place bets on “legacy” approaches – which prove more expensive and slower. By 2050, the Netherlands stands out with 90–100% of its energy from SWB, while the EU average lags behind (perhaps 60–80% renewables, with more nuclear and gas in the mix).
Dutch electricity is ultra-cheap most of the time, whereas countries that stuck with costly nukes and gas have higher energy prices. This gives the Netherlands an economic edge – attracting energy-intensive industries to relocate to tap its cheap green power. (We see hints of this already: data centers gravitate to regions with abundant renewable energy, like Scandinavia or Iberia for cheap solar.) The Netherlands in 2050 could even become a net exporter of clean energy – indirectly – by exporting hydrogen or synthetic fuels made from its surplus. It’s “Europe’s battery” in a way, but one that also powers its own prosperity.
Challenges
Of course, challenges exist: Building 200+ GW of capacity in 25 years means sustained, exponential deployment. The Netherlands would need to keep installing solar panels on every roof, canal, and field at record pace – on the order of 5–7 GW per year (a doubling of the current ~3–4 GW/year pace, as tracked by CBS). Grid upgrades must race ahead to handle 100% electrification (remember, demand is rising to ~500 TWh by 2050 with EVs and electric heat). There could be public resistance to wind farms or new transmission lines. But in this scenario, strong policy and societal consensus (perhaps galvanized by climate urgency or the proven success of early projects) overcome these hurdles.
The Dutch “Delta Plan” for energy transforms the landscape akin to the famous waterworks – with wind parks at sea and solar dikes on land seen as national pride projects. By 2050, the Netherlands demonstrates what a pure SWB system can do: provide secure, independent energy (no more Russian gas worries), slash CO₂ emissions to near-zero, and enable a thriving economy built on supercheap, clean electricity.
Real-world data supporting this scenario
Dutch studies and policy already lean this way. The Netbeheer Nederland infrastructure outlook includes a scenario where the Netherlands becomes self-sufficient with 180 GW of solar and 60 GW of wind (plus backup gas/hydrogen) – not far from our Scenario 1 figures. In that case, gas plants only serve as occasional backup. TNO’s research emphasizes maximizing sun and wind is priority one, with nuclear “a possible supplement but not to overshadow renewables”. The Dutch offshore wind targets (70+ GW) and solar growth show the pieces are in place.
Scenario 1 basically says: accelerate and double down on these plans now, instead of hedging with nuclear or waiting for others. The outcome is a true SWB superpower realized on Dutch soil by mid-century, even if Europe around it moves slower.
Scenario 2: United Green Europe – The EU Coordinates an Accelerated SWB Transition
In this scenario, the entire European Union sees the light early and bands together to aggressively build a pan-European SWB superpower system. Starting around 2025, the EU ramps up joint investments in renewables, a “supergrid”, and energy storage, treating the energy transition as a continent-wide mission (much like the creation of the EU power market, but turbocharged). All member states align policies for rapid decarbonization via solar, wind, and batteries, sharing resources and best practices. By 2050, Europe as a whole achieves nearly 100% clean power with robust cross-border infrastructure ensuring supply security. This is a best-case, cooperative scenario, leveraging Europe’s diverse geography to everyone’s benefit.
Solar and Wind Capacity (NL and EU)
Under a coordinated push, the Netherlands still expands SWB, but can rely on neighbors for some balancing. By 2050, the Netherlands might install on the order of 100–120 GW of solar and ~70–100 GW of wind – similar total magnitude to Scenario 1, but with a different mix and potentially slightly less overcapacity needed domestically thanks to imports/exports. For example, if sunny Spain is part of the plan, the Netherlands might import solar power during winter afternoons from Iberia or North Africa (via HVDC transmission), reducing the need to plaster every Dutch field with panels. Conversely, Dutch offshore wind (strong in winter) can send power to central and southern Europe during dark months. The EU’s collective targets give a hint: Nine North Sea countries (including NL) agreed to build 300 GW of offshore wind by 2050 together, with the Netherlands committing ~21 GW by 2030 and likely ~72 GW or more by 2050 (RVO).
Europe-wide solar ambitions are equally huge – the EU’s Green Deal and REPowerEU plans call for roughly 1 TW (1000 GW) of solar PV by 2030–2040 (an unofficial figure based on doubling current capacity) and much more by 2050. In this scenario, by 2050 the EU might have multiple terawatts of solar and several hundred gigawatts of wind. The Netherlands’ share (say ~100 GW solar, 80 GW wind) fits into that larger tapestry. Each country plays to its strengths: Southern Europe blankets itself in solar farms; the North Sea becomes a giant wind power plant feeding many countries (the Ostend Declaration explicitly calls the North Sea “the green power plant of Europe” with hybrid offshore grids linking countries).
Eastern Europe could contribute massive onshore wind in the Baltics and solar in the Balkans, etc. Crucially, all this capacity is planned together. Europe avoids duplication and leverages diversity: when the wind isn’t blowing in one region, it likely is in another; when a continent-wide high-pressure doldrum hits (rare), the vast geographic spread means some renewables are still producing, and storage plus demand response cover the rest.
For the Netherlands specifically, being part of an integrated EU grid means it might not need to oversize generation quite as much as in Scenario 1. Perhaps Dutch capacity is sized around ~4× peak demand instead of 5×, because the European grid provides a safety net. Still, by 2050 Dutch demand will be much higher due to electrification (500+ TWh/year), so high capacity is needed. If anything, in a cooperative scenario the Netherlands might specialize more in what it’s good at: offshore wind. We could envision NL having, say, 80–100 GW of wind (mostly offshore) and maybe only 100 GW of solar, relying on solar imports from sunnier locales when needed. (In contrast, Scenario 1 had NL trying to do everything itself.) Indeed, one EU-level scenario had the Netherlands remain an energy importer with 126 GW solar and large imports of clean power (EC JRC 2050 Outlook). So NL might not push solar to the absolute max if it can import Spanish or Saharan solar cheaply via an EU grid. That could keep Dutch solar around 100 GW (still ~8× today’s installed PV). Wind, on the other hand, might overshoot Dutch domestic needs – the Netherlands might build extra offshore wind and export it, because the North Sea wind resource is world-class. Under the EU’s North Sea plans, NL initially considered up to 150 GW offshore by 2050 when coordinating with neighbors, though it settled on 70 GW in national plans (Infrastructure Outlook 2050). In a true EU-allied scenario, perhaps NL pushes to 100 GW offshore (with artificial energy islands and hubs connecting multiple countries).
Battery and Storage
Europe-wide coordination greatly eases the storage challenge. A connected grid can treat the whole continent as one balancing area. That means if the Netherlands is cloudy and calm, it can draw power from, say, Spanish solar oversupply or Swedish hydro. The overall storage requirement is lower per country because of interconnection. Europe also has a trump card: geography in the form of the Alps, Nordics, and other regions suitable for pumped hydro storage (PHES). According to analyses, Europe has over 1100 TWh of potential off-river pumped hydro storage – 40 times more than needed for a fully renewable Europe (Blakers et al., Nature Communications). In this scenario, the EU exploits some of that potential: perhaps tens of TWh of pumped hydro are developed in mountain regions (e.g. Austria, Switzerland, Norway, Spain) as a continental battery. This can cover long lulls. So, the Netherlands doesn’t need to build all 1.5 TWh of batteries itself. It will still deploy a lot of short-term battery storage (for grid stability and intra-day shifting) – maybe on the order of 1.0 TWh of batteries or less within NL – but for multi-day backup, it leans on the European network and shared long-duration storage assets. An example: surplus Dutch wind power on a windy week could pump water uphill in a Romanian PHES plant; a week later, that water can generate power sent back to the Netherlands when calm. Also, green hydrogen plays a coordinated role – rather than each country doing its own small hydrogen buffer, the EU might have a hydrogen pipeline network so regions with excess can send hydrogen to those in deficit. The key is synergy: one area’s surplus becomes another’s supply, reducing the need for each to individually cover worst-case scenarios.
Spatial Footprint
With burden-sharing, the Netherlands might actually devote less land to solar than in Scenario 1. Maybe instead of 800–1000 km² of panels, it can suffice with ~600 km² (by importing some power). Offshore wind area would still be large (the North Sea would be dense with turbines owned by multiple countries). But Europe as a whole certainly uses large areas for renewables – just distributed. A useful analogy: to power all of Europe, you might need solar panels covering an area on the order of one of the smaller EU countries. However, they don’t all have to be in one place (like the oft-cited “size of Belgium” thought experiment). They can be spread from the Spanish plateaus to Polish rooftops. In this scenario, every country rolls out renewables to the max feasible, and additionally, the EU likely partners with neighbors (North Africa, Middle East) to import clean energy. For instance, a pan-Euro grid might bring in Moroccan solar or offshore wind from the Black Sea. So space is much less of a constraint because you effectively have an entire continent’s area to collect energy. The Netherlands can afford to be selective in using its precious land – focusing on dual-use solar (agrivoltaics, rooftops) to minimize conflict.
System Costs & Infrastructure
This is the big strength of Scenario 2 – coordination lowers costs for everyone. By planning generation and grids together, Europe avoids redundant investments and takes advantage of each region’s cheapest resources. The EU would invest heavily in a “supergrid”: high-voltage direct current (HVDC) transmission lines crisscrossing the continent (e.g. linking offshore wind hubs in the North Sea to demand centers in the south, and solar-rich areas in the south to northern countries). The ENTSOs (electricity network operators) have foreseen the need for beefed-up interconnections; studies like e-Highway2050 implied that while a full supergrid may not need US-coast-to-Europe cables, massive grid expansions (annual investments €10–20 billion) are required to support any 2050 low-carbon scenario. In Scenario 2, the EU commits these funds collectively. Perhaps on the order of €300–400 billion by 2050 is spent on cross-border transmission, grid digitization, and storage projects. This might sound huge, but it’s a fraction of EU GDP and likely less than the cumulative cost of maintaining fossil fuel imports and siloed systems. A single year of high fossil prices (like 2022) cost the EU economy on the order of €1 trillion in energy bills and subsidies – a supergrid pays for itself by avoiding such shocks. Also, economies of scale kick in: ordering solar panels and wind turbines by the tens of millions for the whole EU drives prices even lower. The EU could create its own supply chain (factories for panels, turbines, batteries) powered by that cheap energy, making the transition cost-effective and creating jobs.
Curtailment and Surplus Management
Even in a coordinated scenario, there will be times of continental surplus – but the beauty is, with such a large integrated system, curtailment can be minimized. If Spain has surplus solar at noon, it can send it to Germany to displace gas, or pump water in Italian Alps, etc. Overall curtailment might be only ~10–15% of total generation, because there’s always some useful sink across the grid (some country with demand or storage needing charge). The EU would also plan for sector coupling: using electricity in transport, heating, industry in smart ways. For instance, a Europe-wide fleet of EVs (hundreds of millions of them by 2050) becomes a giant distributed battery – charging when there’s extra wind or sun, and potentially feeding back when there’s a shortage. Industrial demand (like electrolyzers, ammonia production, steelmaking via green hydrogen) can ramp up when power is plentiful and pause when it’s scarce, smoothing out the curve. In effect, Europe’s large size averages out variability – a key benefit of union. Curtailment that does occur is not wasted in an economic sense: it indicates the system has been built with enough safety margin. And Europe may choose to overbuild capacity on purpose beyond its own needs, to produce exportable clean fuels (to global markets) or to ensure energy independence. If 2050 arrives and Europe has “too much” renewable power, that likely means it can retire any remaining fossil backup and even help the rest of the world decarbonize by exporting e-fuels or electricity.
Policy and Real-World Alignment
Scenario 2 is essentially the vision of the European Green Deal extended to full fruition. The EU has legally binding climate targets (net-zero by 2050) and has raised its 2030 renewables goal to 45% of energy (EU Commission). Programs like REPowerEU (2022) were responses to reduce gas dependence, calling for a rapid doubling of renewable capacity by 2030. Additionally, a coalition of pro-nuclear and pro-renewables countries both exist – in this scenario, all factions agree to focus on whichever clean solutions deploy fastest and cheapest (mostly renewables, with some nuclear where it makes sense). The EU Nuclear Alliance in reality wants ~150 GW of nuclear by 2050 (roughly maintaining current levels with new builds). In a cooperative scenario, that could happen in parallel in countries like France, but without detracting from the renewables rollout. So Scenario 2 might still see perhaps ~100–150 GW of nuclear across the EU (mostly existing fleet and replacements), contributing ~10–20% of power – but the key is, it doesn’t slow down solar/wind expansion. Europe would also implement supportive policies: a strong carbon price, streamlined permitting for renewables (currently a bottleneck), joint procurement of critical minerals and components, retraining programs to move fossil fuel workers into renewables, and so on. Essentially, Europe treats the transition as its moonshot project, with close coordination like in the formation of the European Coal and Steel Community (but this time for green energy).
For the Netherlands specifically, Scenario 2 is a slightly easier lift than Scenario 1. The Dutch still reach near-100% renewables by 2050, but with Europe’s help. For instance, on days when Dutch demand spikes or production dips, the Netherlands can draw from the European grid (knowing other times it will export). This reduces the amount of “insurance” capacity and storage the Netherlands alone must build. Our modeling earlier suggests NL might need ~1.0 TWh of batteries and see maybe 25% surplus under this scenario, versus 1.5 TWh and 30% surplus if isolated. European integration is like adding a huge battery and flexible demand pool. In fact, studies confirm that connecting regions lowers needed backup: a unified EU grid can cut total storage requirements drastically and avoid each country having to build for its own worst-case (Agora Energiewende).
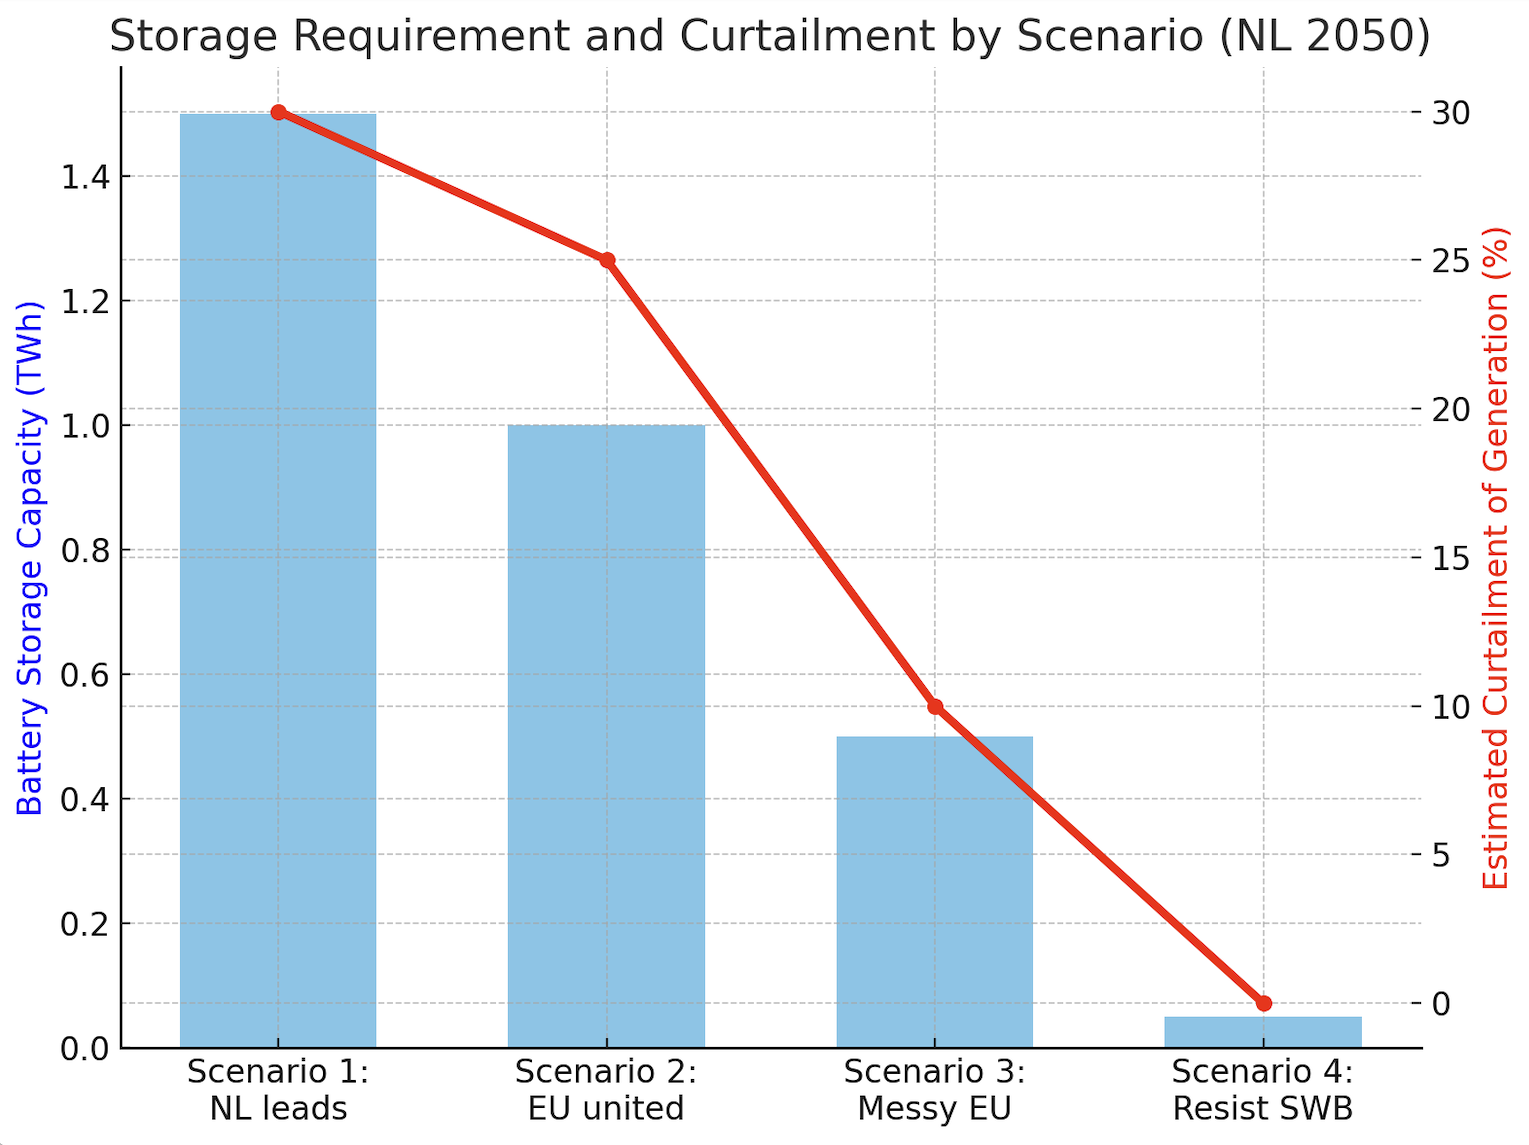
Figure: Estimated battery storage and curtailment in each scenario. Scenario 2 (EU united) requires somewhat less storage for the Netherlands (~1.0 TWh) and experiences lower curtailment (~15% of generation) than Scenario 1, because European grid integration provides balancing and flexibility. In Scenario 1 (NL alone), the Netherlands builds more storage (~1.5 TWh) and overbuilds generation leading to ~30% curtailment, while Scenario 3 and 4 involve less storage and little curtailment simply because far less renewable capacity is deployed.
By 2050 in Scenario 2, Europe has achieved something remarkable: a fully decarbonized power system at optimal cost, fulfilling Tony Seba’s prediction that 100% SWB is the cheapest option (ReThinkX). The lights are kept on across 30 countries by a well-orchestrated dance of millions of solar panels, turbines, and batteries. The continent enjoys energy security like never before (no one can cut off the sun or wind supply), and energy becomes ultra-affordable – a competitive advantage for European industry (IEA). The EU would also drastically reduce dependence on raw fuel imports, improving its trade balance and keeping wealth within. This scenario is essentially the “green utopia” outcome – difficult, but technologically and economically plausible with strong political will and unity.
Scenario 3: Stumbling Toward a Greenish Europe – A Messy, Slower Transition (The “Likely” Case)
In this scenario, the future unfolds not with a bang but a wobble. The EU does decarbonize significantly by 2050, but the journey is messy, fragmented, and slower than optimal. This is a world of political compromises, where no grand consensus on SWB dominance is reached early. Instead, each country follows its own inclination: some invest in renewables, others cling to nuclear or gas a bit too long, many delay difficult decisions. The result by 2050 is a Europe that is largely renewable-powered, but only after losing time and money on suboptimal paths. The Netherlands in this scenario also follows a middling path – pushing renewables, but also hedging bets (e.g. building a couple of nuclear plants, dabbling in fossil-based hydrogen, etc.). This is considered by the user to be the most likely real-world scenario, given how politics and lobbying often play out.
Solar and Wind Capacity: The Netherlands still increases its renewable capacity dramatically by 2050, but not to the theoretical max. We might see roughly 70–80 GW of wind and ~80–100 GW of solar in this scenario for the Netherlands. These figures align with a compromise between the “Adapt” and “Transform” scenarios in TNO’s study. For instance, the Dutch might achieve around 98 GW total renewables by 2050 under a less ambitious path (55 GW solar, 43 GW wind) if they slow down. But let’s assume they do more than that (because even in a messy transition, renewables keep growing due to economics). Possibly by 2050 the Netherlands hits on the order of 80 GW solar PV (many rooftops utilized, some large solar farms but not as much as scenario 1) and 70 GW wind (mostly offshore as planned ~72 GW, with maybe ~8 GW onshore). These numbers would cover the majority of its electricity demand (~90%+ of power from renewables), but not all energy – some fossil or other sources remain. Why not more? In this scenario, progress was slowed by various factors: perhaps nimbyism delayed onshore wind so more capacity couldn’t be built, perhaps the rollout of offshore wind hit supply-chain bottlenecks in the 2030s (already we see warning signs of this), or maybe the government diverted some attention to other solutions (e.g. building that 5 GW of nuclear which took resources and only came online late 2040s).
Indeed, a hallmark of the messy compromise is diverse strategies co-existing: the Netherlands likely does follow through on building two new nuclear reactors by the mid-2030s (together ~2–3 GW) and possibly more later, totalling ~5 GW nuclear by 2050. This matches TNO’s “Transform” scenario where 5 GW of nuclear provided ~7% of electricity. So by 2050, the Netherlands might have a mix of ~90% renewables, a few percent nuclear, and the rest fossil/hydrogen. Many EU countries would have similar mixes – e.g. France keeps its nuclear share ~50%, Germany ends up with maybe 80% renewables but still some gas or imports for backup, Eastern Europe has some coal-to-gas transition hangovers, etc. The overall EU capacity still grows huge (hundreds of GW solar/wind), but inefficiently distributed – e.g. slower grid build-out means renewables often curtailed due to lack of transmission, or some sunny countries don’t fully exploit their potential while others run expensive backup plants.
Battery Storage and Backup
In a patchy transition, there is less concerted effort on storage until later. The Netherlands, for example, might end up with only ~0.5 TWh of batteries by 2050 – enough for short-term balancing but not enough to go without fossil backup. Instead, gas turbines (perhaps converted to burn hydrogen or ammonia) remain in use as a safety net for extended low-renewable periods. Europe as a whole might get “stuck” relying on thermal backup more, because they failed to build sufficient storage or grid interconnections in time. It’s likely that by 2050, some natural gas plants are still around kicking on during peak winter evenings, or alternatively “peaking” reserves using hydrogen fuel. The reliance on these means each country doesn’t build as much storage. In the Netherlands, maybe a few cavern hydrogen storage sites exist and a network of gas/hydrogen plants totaling ~10–15 GW stand ready to supply power for a couple of weeks a year. Batteries mainly serve daily cycling (peak shaving, etc.) – e.g. perhaps tens of GW of 4-hour batteries, summing to a few hundred GWh, plus EVs on the grid. One positive: By 2050, electric vehicles and smart appliances could provide a lot of implicit storage via demand response (in any scenario). In the messy case, this latent flexibility helps but isn’t fully optimized because policy didn’t perfectly coordinate it.
Spatial Footprint
Because renewables deployment is slightly slower and less extensive than scenario 1 or 2, land use is a bit less – but ironically, it could be less efficient. For example, if onshore wind faces opposition, more solar might be used, which demands more area per unit energy in a northern country. Or if big transmission lines are stalled, each country builds more in its own limited space (leading to more local land use than if power could be shared). The Netherlands in 2050 under this scenario might have, say, 500–600 km² of solar panels (including rooftops) – a large area but not saturating every surface. Some agricultural land would host solar farms, but perhaps the more innovative uses (agrivoltaics, floating solar) weren’t scaled up as much due to slower innovation adoption. Offshore, the full 70 GW is built but perhaps not much beyond (no additional international projects). So the North Sea is busy but not at the 300 GW potential, partly because cross-border projects encountered legal and financing hurdles.
Curtailment and Overcapacity
In a half-hearted transition, governments and grid operators might actually avoid intentional overcapacity. The mindset of this scenario is more conservative – seeing curtailment as “waste” rather than an accepted feature. Thus, they might under-build renewables relative to what an optimal plan would call for, aiming for just-enough generation plus some gas backup. This means the system runs at higher utilization but has less cushion. Curtailment might be only ~10% or lower, not because they perfectly matched supply to demand, but because they didn’t deploy that last 20% of capacity that would have created lots of surplus (and ultimately saved storage costs). So paradoxically, lower curtailment in this scenario is a sign of suboptimal investment, not efficiency. It implies the system still leans on fossil/hydro peakers instead of having ample superpower. Overcapacity is limited; there are times the system is stretched because no one built extra solar farms that “weren’t needed on paper.” The downside: the marginal cost of electricity may be higher than in scenario 1 or 2, since there’s no glut of cheap surplus. Power prices in Europe would still be lower than today (due to lots of renewables with no fuel cost), but not as insanely low as in the superabundant case. Consumers might occasionally see price spikes when weather is unfavorable, prompting belated investments in storage afterward.
System Costs & Inefficiencies
Scenario 3 is likely the most expensive in the long run, precisely because it’s inefficiently executed. Different nations duplicating effort or making poor investments raises overall costs. For example, some countries might pour billions into new nuclear plants or CCS (carbon capture) that end up only running at high cost or coming online very late. Others might extend the life of coal plants with retrofits, wasting money, only to shut them down by 2040 under climate pressure. The EU as a whole could easily spend € trillions more on energy between now and 2050 than in scenario 2, due to delayed action and continued fossil purchases in the interim. A telling statistic: the World Nuclear Association noted that maintaining ~100 GW of nuclear and building new ones by 2050 in Europe requires €350–450 billion in new reactor investments plus €45–50 billion on life extensions. If those resources were instead put into cheaper renewables and storage earlier, one might achieve the same carbon reduction for less. But scenario 3 sees lots of such parallel costly endeavors. We can expect that by 2050, Europe meets its climate target just in time (or even a bit late), having thrown a mix of solutions at the wall to see what sticks, and writing off quite a few failures.
Concretely for the Netherlands
They likely spend tens of billions on developing a hydrogen infrastructure that partly relies on natural gas reforming with CCS (so-called “blue hydrogen”) as a transition. Some Dutch industrial heating or power might use blue hydrogen in the 2030s, which is more expensive and not zero-carbon (some emissions remain). By 2050 they switch that to green hydrogen, but the detour cost money and time. The Netherlands also invests in 2–5 GW of nuclear (the government’s current plan is 2 reactors by ~2035, RVO, which in this scenario do get built by, say, 2040, and maybe another by 2050). Those provide perhaps ~10% of power in 2050. They help reduce emissions but at a higher cost per kWh than the concurrent wind/solar. Meanwhile renewables still dominate growth because market forces drive them – by the 2030s, even in a hesitant policy environment, building new solar/wind is simply the cheapest way to add capacity, so utilities do it. But without strong grid planning, you get things like grid congestion (already an issue in NL by mid-2020s, NOS) causing wind/solar farms to wait for connections or run at reduced output.
Real-World Reference
This scenario mirrors what we see today: an EU where some members champion nuclear (France, Poland), some ban it (Germany, Austria), some push renewables to the max (Denmark, Spain) while others lag. The EU Energy Union concept tries to integrate these efforts, but national interests often interfere. We already observe capacity markets and subsidies that prop up fossil or other domestic priorities, fragmenting the single market. For instance, capacity payments in many countries keep coal/gas plants alive “just in case”. In a messy transition, these continue for longer, slowing the phase-out of fossil fuel plants. Also, consider nuclear new-build delays: in reality, nuclear projects in Europe have been notoriously delayed and over budget (Finland’s Olkiluoto-3 took ~15 years, Flamanville in France still unfinished). If multiple countries attempt nuclear build-outs simultaneously without streamlining, many might not be done by 2050. So scenario 3 could even end up with less nuclear on-line than planned, but the attempt still consumed political capital and money that could have gone to SWB.
By 2050, scenario 3’s Europe does have mostly clean electricity – likely >90% carbon-free, through a patchwork of renewables (maybe ~75% of generation), nuclear (~10–15%), and a bit of gas w/ CCS or biomass. The Netherlands specifically might reach ~90–95% CO₂-free electricity (some gas for heat or peak). They probably miss the opportunity to become a big exporter of cheap energy because they didn’t create huge surpluses – instead, they meet their needs with a bit of import/export as needed. The economic benefits of supercheap power are delayed – energy prices are moderate but not ultra-low. By the 2040s, there may even be a sense of regret: as more data shows that an all-SWB approach could have saved money, policies start shifting more aggressively toward SWB deployment to hit 2050 targets. In essence, scenario 3 gets there in the end but “takes the scenic route”. The concluding section will argue that even if this is the path we take, the inexorable economics of SWB eventually force the issue – perhaps in the 2050s Europe would then rapidly catch up to scenario 1 levels of superpower. But in the meantime, we would have lost time in mitigating climate change and spent more than necessary.
Scenario 4: The Contrarian Lock-In – Europe Digs in on Legacy Energy (The Cautionary Tale)
Finally, imagine a future where, against all economic and climate logic, the EU and the Netherlands actively resist the SWB revolution. In this scenario, influenced by powerful fossil fuel interests or populist politics, Europe doubles down on its “legacy” energy infrastructure. There’s widespread misinformation about renewables (“the sun doesn’t always shine, wind doesn’t work!” etc.), and perhaps climate urgency is downplayed. Investment flows to prolonging oil, gas, and coal use (with half-hearted carbon capture attempts), and to maintaining old nuclear plants and building a few new ones – while solar and wind deployment stalls. Essentially, Europe tries to outrun a technology disruption by clinging to the incumbent systems. By 2050, the consequences are dire: Europe is left with expensive, outdated energy, having largely missed the SWB superpower bus.
Solar and Wind Capacity
In this worst-case scenario, the growth of renewables in the Netherlands (and much of Europe) slows dramatically after the mid-2020s. Perhaps some early targets are met (because they’re already in motion till 2030), but then momentum fizzles. Let’s say by 2050 the Netherlands only achieves on the order of 40–50 GW of solar and maybe ~30 GW of wind. That is a far cry from what is needed for net-zero, and indeed likely insufficient to cover even its electricity needs, let alone total energy. For context, 50 GW of solar is roughly what the Dutch might already have by the mid-2030s if current trends continued (the country hit 16.5 GW by mid-2022, and was on track for ~100 GW by 2050 under normal circumstances). So a slowdown means deliberately halting or discouraging further expansion. This could happen through policy: for instance, the government stops subsidies or even taxes new renewable projects, perhaps claiming they “threaten grid stability” or some such pretext. Local opposition to wind farms might be stoked to block new builds. The offshore wind roadmap could be shelved or delayed, meaning NL might stall out at say 21 GW (the 2030 goal) or not much beyond. Onshore wind could stagnate or even shrink (some turbines retired after 20 years and not replaced, due to resistance). Solar PV might still grow on rooftops to some extent (since individual citizens and businesses may install it to save money unless actively banned), but without support and with potential grid constraints, it might only reach maybe 50 GW instead of 150. So by 2050, renewables might supply, say, only ~50% of Dutch electricity in this scenario – ironically about where they already reached in 2024. It’s as if progress plateaus.
What fills the gap?
Likely a combination of fossil fuels and a bit of new nuclear. The Netherlands might fulfill the current plan for 2 new nuclear reactors by ~2040 (adding ~2–3 GW) and perhaps even announce more (maybe small modular reactors) – but given the slow pace, let’s assume only those 2 large reactors (and the existing 0.5 GW Borssele plant, if life-extended) are operating by 2050. That might contribute maybe 10–15% of electricity. The rest might unfortunately be fossil-fueled. Possibly the Netherlands keeps several gas power stations running, theoretically with carbon capture (though in this scenario, perhaps CCS deployment also disappoints, as it often has historically). Some coal plants might even operate longer than planned, or be converted to biomass (with arguable climate benefit). Essentially, in 2050 the Netherlands would still be emitting significant CO₂ from its energy sector – meaning it fails climate targets (or achieves them only on paper by using dubious offsets). The EU as a whole, in this scenario, similarly falls short: maybe only ~50–60% renewable electricity union-wide (instead of 90%+ in other scenarios). Nuclear might hold ~20–25% share if the nuclear alliance succeeded in building 30+ new reactors – but that’s optimistic given current track record. More likely in a contrarian world, even nuclear expansion underperforms because the same forces that undermine renewables (status-quo inertia, cost overruns) can hit nuclear too. So the slack is taken up by natural gas and coal which politicians justify as “necessary for reliable power”.
Battery Storage
In such a scenario, there is minimal investment in battery storage. With renewables sidelined, the perceived need for storage is less (since they just keep running gas plants to handle variability). By 2050, the Netherlands might have only, say, 50 GWh of batteries (just a few utility projects and some EV integration), which is negligible compared to what a full transition would require. Instead, the grid relies on legacy flexibility: gas peakers, interconnections to import electricity (possibly still importing fossil-based power from neighbors). The concept of using EVs as grid assets might not be realized because perhaps EV adoption itself is slower here (in a contrarian future, maybe they also resist electrification of transport, favoring biofuels or hydrogen combustion cars due to lobbying). So the virtuous cycle of more renewables → more storage → even more renewables never gets going. Curtailment of renewables is very low, but not as a positive – rather because there’s little excess generation ever built.
Spatial Requirements
Low renewable build-out means land use changes are minimal in this scenario – which might be the very argument contrarians use (“look, we saved the countryside from all those wind turbines!”). Perhaps only current wind farms exist and no new major ones, so the visual landscape stays mostly fossil – power plants and maybe some new pipelines or import terminals (for LNG or hydrogen). There might be new infrastructure on the fossil side: for example, if Europe bets on hydrogen but not green hydrogen, they might build a network of hydrogen pipelines carrying blue hydrogen (from reformed natural gas) or even perpetuate natural gas networks. These have their own spatial/environmental footprint (fracking sites, CO₂ storage sites for CCS, etc., often outside public eye). The notion of covering the desert with solar to power Europe (Desertec idea) would be off the table; instead maybe Europe covers parts of the U.S. or Middle East with long-term LNG contracts and pipelines – i.e., externalized land footprint.
System Costs & Consequences
This scenario is a recipe for economic self-harm for Europe. By obstinately sticking with legacy energy, Europe would face much higher energy costs in the 2030s and 2040s than in the scenarios where it embraced cheap renewables. Already by the 2020s, new solar and wind beat existing fossil plants on cost ; by the 2030s, they will be far cheaper. So resisting them means paying more per kWh. Europe would also remain at the mercy of fossil fuel price swings and geopolitics – a repeat of the 2022 gas crisis could happen again, since dependency remains high. The EU’s own analysis suggests that if it fails to deploy storage and renewables, it risks being “locked into fossil fuel backup” and volatile prices . In scenario 4, that’s exactly what happens: Europe perhaps in desperation invests in massive LNG import capacity (some of which we already see being built post-2022) and keeps paying for gas and oil from various sources. The cumulative import costs from 2025 to 2050 could be astronomical – trillions of euros that in scenarios 1 or 2 would have been largely saved by domestic renewables. Furthermore, Europe loses technological leadership. While it clings to old tech, other parts of the world (perhaps the U.S., China, India) go full steam ahead with SWB, driving those costs even lower and reaping industrial benefits. By 2050, Europe could find itself uncompetitive: industries that rely on ultra-cheap electricity (steel, ammonia, computing) would prefer locations in Asia or America where SWB power costs are a fraction of Europe’s fossil/nuclear-heavy electricity. It’s not far-fetched – already, a country like China is installing more renewables than anyone and stands to lead in battery tech; if Europe dallies, it could be importing clean tech from those who forged ahead, rather than exporting it.
In the Netherlands, the contrarian path would also mean failing climate goals. The Netherlands has a legal target of climate neutrality by 2050; in this scenario they’d miss it by a wide margin, unless they resort to creative accounting. They might, for example, try heavy carbon capture – capturing CO₂ from industry and power plants and storing it under the North Sea. Some of that is planned even in normal scenarios (the Port of Rotterdam has CCS projects). But to compensate for lots of fossil use, CCS would have to be rolled out on an unrealistic scale. Aside from cost (CCS electricity is very expensive per kWh, making it a poor substitute for renewables), there are physical limits. The “Porthos” project in NL aims to store ~2.5 million tons CO₂ per year by 2030, tiny compared to national emissions. In scenario 4, they’d need dozens of Porthos-scale projects to hide all the carbon from power, industry, transport still burning fossil fuels. It’s unlikely to succeed. So Europe likely fails its Climate Law obligations . Perhaps by 2050 global pressure forces a reckoning, but then Europe would have to pivot very late to SWB under more urgent conditions.
Misinformation and Public Sentiment
A crucial part of this scenario is the promotion of misinformation that keeps the public skeptical of SWB. We’ve seen glimpses: claims that “renewables can’t keep the lights on,” exaggerations of battery environmental impact, or overstatement of land needs (“we’d have to cover the whole country with panels!” – which is false, as noted earlier that only a few percent land is needed ). In a contrarian future, these narratives dominate media. Perhaps short-term problems (like a blackout that happened to coincide with a wind lull) are blamed on renewables unfairly, prompting moratoria on further wind farms. Maybe there’s a political swing where a coalition comes to power rolling back green policies (as occasionally happens in various countries). The EU might fracture on energy: e.g., some Eastern European members could veto stronger renewable targets, citing sovereignty or cost (this has precedent; Poland has often been a holdout on EU climate ambitions). So EU policy could stall out at, say, 50% renewables mandate and no further.
Interestingly, the EU’s own bureaucratic inertia could play a role. If the taxonomy labels gas and nuclear as “green” (which it did in 2022 to some controversy), funds might flow to those at the expense of solar/wind. In scenario 4, one could imagine heavy lobbying success for gas: new gas plants keep getting built on the rationale of “transition fuel” well into the 2040s, and then they become stranded assets when the world inevitably moves on. Essentially, scenario 4 is a story of lock-in – Europe locking itself into another cycle of fossil infrastructure that becomes economically untenable as the rest of the world embraces the disruption.
By 2050, the Netherlands in this scenario would perhaps derive maybe 50–60% of electricity from fossil fuels or inefficient sources, with only the baseline renewables that got built early on accounting for ~40–50%. It would still have ~CO₂ emissions in its power sector (maybe not far off from today’s). To hit net-zero, they’d be banking on importing carbon credits or using biomass in power plants (which has its own controversies regarding sustainability). One could envision a somewhat dystopian scene: while other countries have vibrant clean energy industries and declining energy bills, the Netherlands and parts of Europe are paying high prices to maintain old coal and gas plants (perhaps with taxpayers subsidizing them for “grid stability”), and citizens wonder why energy is both expensive and not fully clean despite decades of warnings. Europe’s share of clean tech manufacturing would be minimal, since it didn’t invest early, thus it misses out on economic opportunities too.
In short, Scenario 4 is a lose-lose
it fails environmentally, economically, and technologically. It is the scenario of obstruction and delay. The only silver lining – if we can call it that – is that eventually economics would force change. Tony Seba often notes that disruptions don’t wait for laggards – they overwhelm them. If Europe stuck stubbornly to legacy tech, by the 2050s it would face plants that are costly to run, while new SWB capacity elsewhere is so cheap that importing clean power or technology becomes irresistible. So Europe would likely undergo a rushed transition in the 2050s anyway (or suffer irreparable economic decline). Scenario 4 basically prolongs the inevitable at great cost. It is a warning of what happens if we let fear, misinformation, or short-term interests override the clear trendline of technology.
To back up this scenario with real data: We see hints of contrarian moves in some places. Some governments still invest in new fossil infrastructure (e.g. LNG terminals that risk becoming stranded). There are political parties in Europe openly skeptical of climate measures who could, if in power, slow or reverse policies. The EU’s import dependency hit a record 62.5% in 2022 – scenario 4 would keep or even increase that dependency, contrary to the stated goal of reducing it. It’s noteworthy that even in scenario 4, some renewables would be built because they are now often the cheapest new option regardless of policy. For example, corporations might install solar just to reduce bills, or some EU countries might ignore the general trend and go green anyway (perhaps countries like Denmark or Portugal would still pursue renewables domestically). So scenario 4 doesn’t mean zero solar/wind growth (our estimate of 50 GW solar NL is evidence some growth happens, just much less than it could). It’s more about political stance – actively choosing old energy over new. It’s the least plausible long-term (because it’s fighting economics), but not impossible short-term if attitudes regress.
Europe’s history has a few analogous cautionary tales – e.g., the stubborn clinging to coal in the face of cheaper gas and renewables has already left some regions economically behind. Scenario 4 essentially multiplies that effect continent-wide.
Having examined these four scenarios in detail, it’s clear that the outcomes for the Netherlands and Europe range from thriving in a cheap-energy future (Scenarios 1 & 2) to struggling and lagging behind (Scenario 4), with Scenario 3 as a muddled middle ground. In all cases, by 2050 the technical capability exists for Europe to be mostly renewable-powered – the differences are in how efficiently and proactively it gets there.
Conclusion: The Inevitability of the SWB Superpower – Even Through a Messy Transition
Even if Europe stumbles along the messy path (Scenario 3, which we deemed most likely given current trajectories), the economic logic of the Solar-Wind-Battery superpower is inexorable. Solar, wind, and batteries will continue to drop in cost and improve in performance due to global innovation and economies of scale. By the 2030s, their cost advantage will be so overwhelming that, rationally, no new fossil or nuclear capacity will be able to compete on pure economics. Already by 2019, renewables accounted for 72% of new global power capacity additions, a sign of where investment is flowing. This means that even if policy is slow or inconsistent, market forces and consumer choices will push SWB forward. Utilities will increasingly choose solar farms and wind parks because they’re cheaper to build and operate than gas plants (even without subsidies). Households will stick PV on their roofs and buy electric cars because it saves money in the long run and offers independence from volatile fuel prices. Corporations will demand green power purchase agreements to meet sustainability goals, further driving renewables deployment. In short, the transition can be delayed but not derailed– each year of delay simply means that when change finally comes, it comes at a larger scale as pent-up demand and overdue replacements cascade in.
We see this pattern in technology disruptions historically. Early resistance (regulations favoring horses, incumbents lobbying against cars) gave way once the benefits could no longer be ignored – then adoption went into overdrive. Similarly, by the late 2020s, if some European regions still resist, they may face increasing public pressure as other countries enjoy cheaper, cleaner energy. Energy consumers – voters – will ask, “why are our bills higher and our air dirtier?” Businesses will threaten to relocate if energy isn’t clean and cheap. Eventually, even reluctant leaders pivot or lose support. Thus, even Scenario 3, with all its bumps, likely ends with Europe mostly decarbonized by 2050 and embracing SWB out of necessity, if a bit late. And Scenario 4, the full contrarian mode, is even less sustainable – it would almost certainly crumble under economic competitiveness issues well before 2050, forcing a course correction. In reality, elements of scenario 4 might occur in pockets or short periods, but it’s hard to imagine an entire continent sustaining that path for 25 years against the tide of global progress.
The radical cost advantage of SWB will ultimately prevail. Solar and wind have a unique quality: the more you build them, the cheaper they get, whereas fossil fuels get more expensive (extracting the next barrel of oil or cubic meter of gas often costs more). Batteries too are on a manufacturing learning curve, projected to halve in cost again in coming decades. Tony Seba’s exponential adoption model indicates that once renewables pass a certain threshold of penetration and cost superiority, adoption accelerates non-linearly. We may reach a tipping point in Europe where, for example, new car sales swing nearly 100% electric within a couple of years (some countries are already at 80% EV sales); or where proposals for new fossil power plants simply vanish because nobody can finance them against cheap wind/solar bids. This flips the dynamic: instead of renewables adapting to the old grid, the grid and market will adapt to optimize renewables, further reinforcing their dominance.
One could argue we are nearing that inflection already. The Netherlands overshot its 2023 offshore wind targets and is hitting >50% renewables years ahead of some expectations. Europe survived a winter without Russian gas by massively ramping efficiency and alternative supplies – showing the system can change quickly under pressure. If that same urgency were applied to building SWB infrastructure, the disruption could accelerate. And as SWB superpower gains momentum, it has self-reinforcing benefits: near-zero marginal cost energy will spur new industries and jobs, which then advocate for even more cheap energy. It’s a virtuous cycle. Areas that embrace it (say, a Scenario 1 Netherlands or a very green EU) will thrive and become magnets for investment – putting pressure on laggards to catch up or lose out. In a sense, energy could become to the 21st century what computing was to the late 20th: a field of rapid innovation where falling costs lead to ubiquitous adoption and new applications nobody imagined at first (just as cheap computing led to the internet economy, cheap clean energy could lead to synthetic fuel economies, hyper-electrification, and things like direct air capture of CO₂ powered by surplus energy, making negative emissions affordable).
In conclusion
While the four scenarios paint very different pictures of 2050, the destination of an SWB-powered world looks increasingly inevitable – the only question is how bumpy or smooth the road there will be. Scenarios 1 and 2 show that with vision and coordination, the Netherlands and Europe can achieve an energy superabundance that not only meets climate goals but boosts prosperity (imagine, energy so cheap and clean that it ceases to be a limiting factor – a true revolution in human affairs). Scenario 3 reminds us that political will matters – a lack of it can slow progress and raise costs, but only up to a point. And Scenario 4 serves as a stark warning: ignoring the S-curve disruption will leave one on the wrong side of history (and economics). Fortunately, the current trends suggest that outright resistance is breaking down as reality shows the benefits of SWB. The EU’s latest policies and the behavior of energy investors indicate a shift towards embracing the new paradigm, even if haltingly.
Ultimately, whether by deliberate planning or by market inevitability, Europe around mid-century is poised to enter the Age of SWB Superpower – an era defined by plentiful, affordable, clean energy. The Netherlands, with its wind-swept North Sea and innovative spirit, is well positioned to be a leader in that era (as in Scenarios 1 or 2). But even if it “stumbles” along (Scenario 3), economic gravity will pull it toward the same endgame: turbines on the horizon, panels on every roof, batteries humming, and fossil fuels relegated to the history books. The sooner we recognize this and act, the smoother our journey to 2050 will be – and the greater the benefits we can reap in terms of climate stability, energy independence, and economic vitality. The SWB disruption is here; Europe can either harness the S-curve or be swept along by it. One way or another, the solar, wind, battery superpower will shine through.